Dashboards
The Virima application dashboards provide a quick and easy way to locate and view information. There are several types of dashboards:
Home Page Dashboard
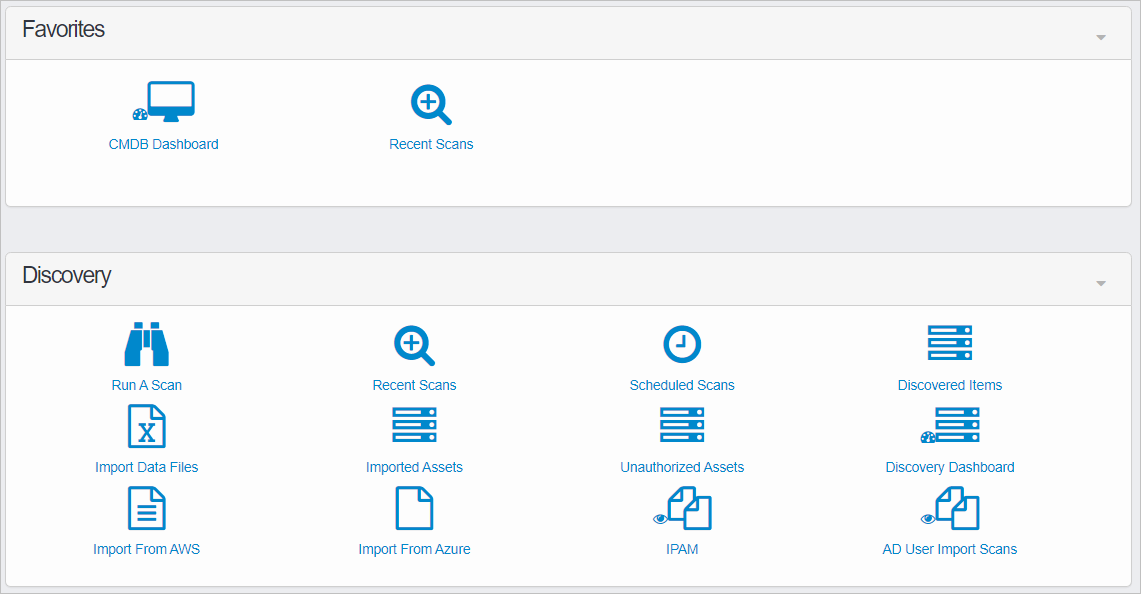
The Home dashboard provides sections for Favorites, Dashboards (such as CMDB, Changes, and so forth), and direct access to non-dashboard functions, such as Discovery, ITSM, and others.
|
Any of the icons shown can be added to the Favorites section. Click on the icon and drag/drop it into the "Favorites" section. To remove an icon from "Favorites," click the icon and drag it up to the top of the page into the red square with the text that reads, "Drag here to delete." Note that the icon is not deleted; it's simply removed from the Favorites section. |

My Dashboard
Use this function to view user-related data and selected reports.
| There are several types of dashboards throughout the application. For example, under ITSM, each management function has its own dashboard, as does ITAM Configuration Management. Refer to those individual sections for details. |
In the navigation pane, select My Dashboard. The My Dashboard window displays.
The upper portion of the windows contains user-related data, such as CIs, requests, problems, incidents, changes, knowledge items, and known errors.
|
The list at the top of the window cannot be changed or removed as this information displays other data collected throughout the application. However, the details for a line item can be viewed by clicking on the item. |

Function-Specific Dashboards
These dashboards are specific to certain functions and display a list of all activities.
The following functions contain dashboards:
In the example below, the Incident Management Dashboard lists recent incidents.

In the example below, the Request Fulfillment Dashboard lists all recent requests.

Related Topics
Other Functions and Page Elements