My Dashboard
This content is currently under development.
Use this function to view activities as they apply to the logged in user.
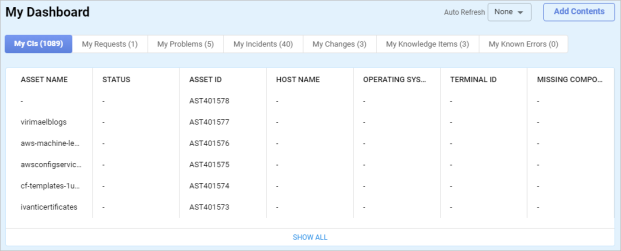
By default, the following section of items is placed at the top of the dashboard: total number of incidents, requests, changes, problems, known errors, knowledge items, as well as the number of CI closures.
| 1. | From the navigation pane, select My Dashboard. The Dashboard window displays. The following tabs are displayed: Incidents, Requests, Changes, Problems, Known Errors, Knowledge Items and CIs, along with the number of items for the selected tab. |
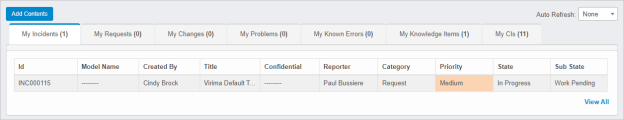
| 2. | Click a tab to view the relevant information. |
| 3. | To add contents to the dashboard, click Add Contents. |
| 4. | Click View AllShow All to open the applicable function for the selected tab. For example, the Configuration Items window displays when View AllShow All is clicked while viewing the My CIs tab. |
Other Functions and Page Elements
Related Topics