Viewing a Recent Scan Page
Clicking on a specific scan entry from the Recent Scans table redirects users to a detailed scan summary page. This view provides an in-depth breakdown of scan activity, target systems, and results, useful for verification, troubleshooting, or audit purposes.
Explanation of Sections and Fields
Top Panel (Header Area)
-
Scan title – Displays the scan ID and name (e.g., Scan Mamatha Laptop 172.16.5.187).
-
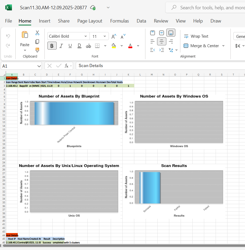
Export scan report – Button to export the full scan report in formats like XLSX.
|
Field |
What it shows |
How it’s determined / example |
|
Scan Range |
The exact target for that row. |
The value you entered in IP Range (e.g., 192.168.40.169, 192.168.40.1-50, 192.168.40.0/24). |
|
Client Name |
The Discovery client/tenant that ran the scan. |
Selected in the job (e.g., testing1,Testing_virima). |
|
Probe Name |
The discovery probe used. |
From the job (e.g., `Deep Host Scan WMIC) |
|
Start Time |
When scanning of that entry started. |
Shown in the job’s timezone; e.g., 09/11/2025 08:32:39 AM. |
|
Windows Hosts |
Count of endpoints confidently identified as Windows. |
Determined via WMI/SMB fingerprint, banners, and credentials. |
|
Unix/Linux Hosts |
Count of endpoints identified as Unix/Linux. |
Determined via SSH fingerprint, OS banners, and credentials. |
|
Network Devices |
Count of network gear (switches/routers/firewalls/APs, etc.). |
Identified mainly via SNMP fingerprints/MIBs and device signatures. |
|
Unknown Hosts |
The targets are reachable, but none of the supplied credentials authenticated, so the OS couldn’t be identified. |
Typical causes: missing/invalid credentials, blocked ports, partial responses. |
|
Unknown Devices |
Devices discovered but not fully classified (often due to missing credentials/ports). |
Insufficient SNMP/SSH/WMI data or atypical fingerprints. |
|
Total Hosts |
The sum of all counts for that entry. |
Formula: Windows + Unix/Linux + Network + Unknown Hosts + Down Hosts + Unknown Devices. |
-
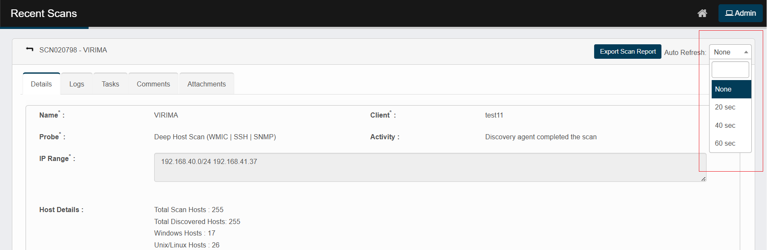
Auto refresh – Automatically refreshes the page at defined intervals.
How to view the report
-
Use filters/pivots to roll up by Client, Probe, or Scan Range.
-
High Unknown/Down counts usually point to credential or connectivity gaps (check WMI/SSH/SNMP access, firewalls, and routing).
-
Remember the Start Time reflects the schedule’s timezone, not your current browser time.
-
If you scanned multiple entries, you’ll see one row per entry—counts are per entry (not de-duplicated across rows).
Tabs Section
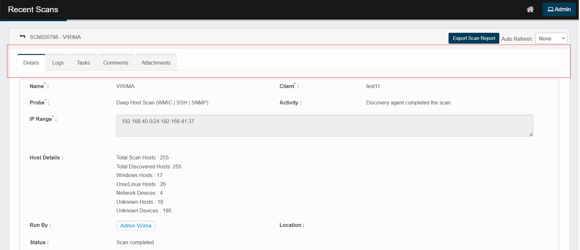
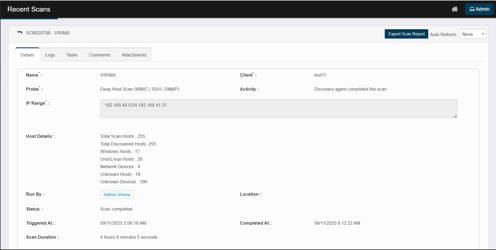
Details (default)
-
Name, Probe, Client, Activity – who/what ran and the last action.
-
IP Range – targets for the run.
-
Host Details – quick counts (total hosts, Windows/Unix, network/unknown).
-
Run By, Location, Status, Triggered At, Completed At, Scan Duration.
-
Results grid (bottom): one line per discovered endpoint with filters for:
-
IP Address, Host Name, Result, Details, Device Type, Device Summary
(e.g., OS, domain/workgroup, MAC).
Tip: use the column filters to narrow to a device quickly.
-
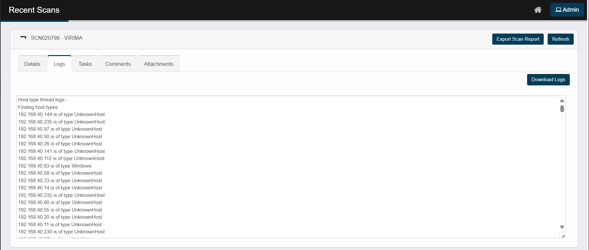
Logs
-
Full execution log for the run (scrollable).
-
Buttons: Download Logs (saves the full text) and Refresh.
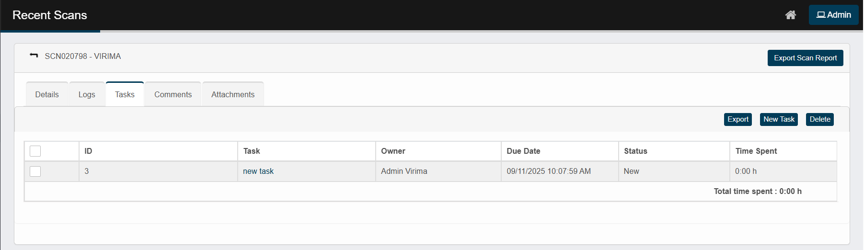
Tasks
-
Add follow-up work related to this run (New Task) or remove tasks (Delete).
-
Useful for assigning remediation or verification actions.
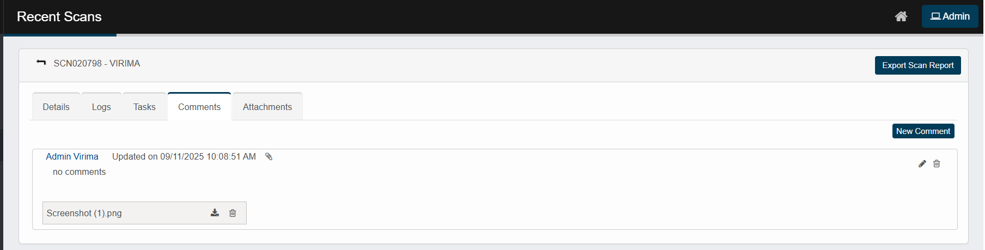
Comments
-
Add internal notes for this run (New Comment).
Good for handoffs or documenting exceptions.
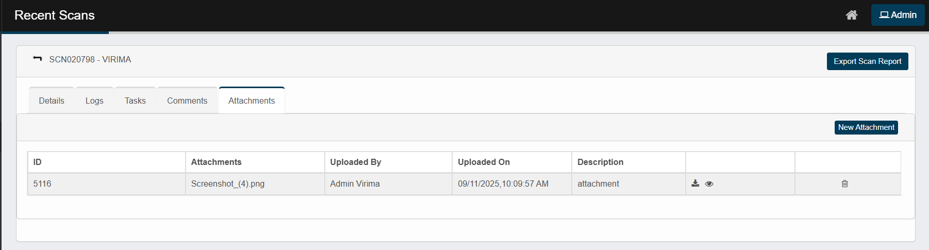
Attachments
-
Use New Attachment to upload supporting files for this specific record—e.g., billing evidence, screenshots, or exported reports. The files are stored with the scan record and appear on the Attachments tab for easy reference.