Logs Tab
The Logs tab provides a real-time, detailed trace of the scan's progress and actions taken by the discovery engine on the targeted host(s). It's especially helpful for troubleshooting, validation, and understanding scan behavior.
Details include:
-
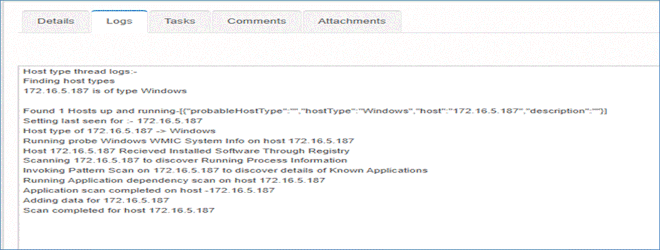
Host type discovery
Lines like:-
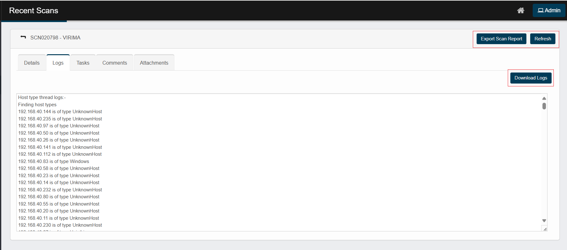
192.168.40.83 is of type Windows → OS fingerprinting succeeded.
-
… is of type UnknownHost → the probe couldn’t fingerprint the OS (often due to closed ports or blocked protocols).
-
-
Sensor invocation
Examples (you’ll see many of these):-
Going to invoke sensor Windows WMIC System Info …
-
… Windows Installed Software …
-
… Certificate Check …
These show which sensor ran for that IP and phase (WMIC/WMI, SSH, SNMP, disk, process, certificate, etc.).
-
-
Responses / outcomes
-
… to process response or Scan completed indicates a successful sensor pass.
-
Timeouts, auth failures, or connection errors will be printed here useful for troubleshooting credentials, firewalls, or network reachability.
-
Export / Download actions
-
Export Scan Report
Click Export Scan Report (top-right). You’ll see a Success message— the report is generated in the background, and you’ll receive it by email when it’s ready. -
Download Logs
Open the Logs tab and click Download Logs. A PDF of the run logs is downloaded immediately to your browser’s download folder. -
Refresh: Click Refresh to refresh the logs.
Why the Logs Tab Is Important
-
Debugging: Identify where a scan may have failed or stalled.
-
Verification: The Logs tab confirms that all scan modules — such as software inventory, running processes, and application dependencies — ran successfully.
-
Shows each scan request
-
Confirms execution
-
Highlights errors
-
Sensor processing confirmation
-